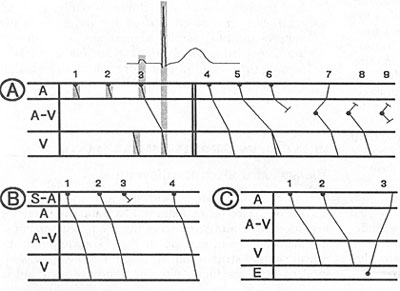
Figure 94-35e
Ladder diaagram
for analysis of cardiac arrhythmias.
A. Charting of P-wave and QRS complexes
and deduction of conduction relationships for a normal sinus impulse
are demonstrated in A1-3. The diversion of lines shown in the V level
in A5 is used to indicate aberrant intra ventricular conduction, and
the incomplete cross-hatched line in the AV level in A6 represents an
impulse blocked inthe AV junction. The AV junctional impulses with retrograde(7)
and antegrade (8), and block in both directions resulting in a concealed
extrasystole (A9) are shown next.
B. Diagram used to analyse sinoatrial
conduction is demonstrated .A sinus impulse that fails to conduct to
the atrium is indicated as in B3.
C. Ventricular ectopic activity (e) is
depicted as shown in C3, which represents a premature ventricular contraction
with retrograde conduction to the atrium.