The electrocardiogram is a recording of
the electrical activity of the heart as it undergoes excitation
(depolarization) and recovery (polarization) to initiate each
beat of the heart.
This electrical activity is represented by a
tracing showing the various phases of the activity above or
below an isoelectric line (positive above and negative below)
over time in a progressive fashion from the sinus node (the
site of initiation of the electrical impulse in the cranial
portion of the right atrium) to the AV node (in the right atrium)
and then into the HIS-Purkinje bundle, where it spreads through
both the left and right ventricular bundles (located on each
side of the interventricular septum respectively). The activity
spreads from these bundles out to each of the ventricles of
the heart.
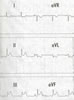
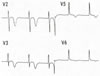
This activity is recorded using an electrocardiographic
machine connected to the patient with four electric leads (labelled
1, 11 ,111, AVR, AVL, AVF) on the ankles and wrists and six
on the front of the chest over the heart area (labelled V1-6).
The normal pattern of the ECG allows analysis
to determine whether there is any abnormality in any particular
patient's ECG (see fig
94).
The activity is classically represented by labeling the initial
activity a P wave and in succession QRS, T and U waves. The
P wave represents the electrical excitation of the atria, which
causes contraction of both atria. The QRS complex represents
the electrical excitation of the ventricles, which initiates
the ventricular contraction (systole) shortly after the Q wave.
The T wave represents the return of the ventricles from excitation
to a normal state. The end of T wave marks the end of systole.
The T wave represents the return to normal of the specialized
muscle fibers, that make up the pacemaker, which spreads the
electrical signal throughout the ventricles. The interval between
the onset of the P wave and the onset of the QRS is called the
PR interval, which usually does not exceed 0.20 seconds. The
QRS duration is from 0.08-0.10 seconds. There is an isoelectric
line separating the activity of the P wave from the QRS and
the QRS from the T wave.
Counting the number of QRS complexes
occurring per second gives the heart rate of the individual.
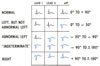
The electrical axis (EA) of the heart is a vector originating
in the center of Einthoven's equilateral triangle and refers
to the direction of the cardiac activation process as projected
in the limb leads (1, 11, 111, AVR, AVL, AVF). The term "electrical
axis" generally refers to the QRS complex.
A simple, though not precise,method of calculating
the quadrant (or parts of a quadrant) in which the EA is located
consist of using the maximal QRS deflection in leads 1 and AVF
and if necessary, lead 11 (see figure 94-1).
| ABNORMAL ST-SEGMENT
CHANGES |
In electrocardiographic language "injury"
refers to abnormal ST-segment changes (see figure 94-2), "necrosis"
implies abnormal Q waves, and "ischemia" implies symmetrical
T-wave inversion (or elevation). According to current-of-injury
theory, ST-segment elevation occurs when the injured muscle
is located between normal muscle and the corresponding precordial
electrode. On the other hand, ST-segment depression occurs when
normal muscle is located between the injured tissue and the
corresponding electrode.
Chronic ST-segment elevation indicates the existence
of a large infarction, mainly anteriorly, usually with ventricular
aneurysm.
Coronary
artery disease (see definition on my website) is the most
frequent cause of abnormal ST-segment changes.The latter, however,
can be due to pericarditis (see definition and example of resultant ECG on my website)
or to subendocardial injury resulting from the effects of drugs.
| DEFINITION: PERICARDITIS
ECG CHANGES |
The ECG pattern of acut (generalized) pericarditis
not due to MI is produced by the associated epicardial epimyocarditis,
which in turn results in diffuse "epicardial injury".
The ST segments can be elevated in all leads except AVR and
rarely, in V I (see ECG in definition pericarditis). Symmetrical
T- wave inversion (due to epicardial "ischemia") usually
develops after the ST segments have returned to baseline (but
can can appear during the injury stage). Neither reciprocal
ST-segment changes nor abnormal Q waves are seen. In most cases
of acute pericarditis, the PR segment is depressed in leads
V 2-6. Average ECG resolution of acute pericarditis has to be
differentiated from a normal variant cccurring in some normal
young persons that is often referred to incorrectly as early
repolarization. The latter consists, in the left chest leads,
of normal ST-segment elevation associated with usually large
R waves that have small r' deflections or notches starting above"
the baseline (see figure 94-3 above).
| DEFINITION: ABNORMAL
Q WAVES |
Abnormal Q waves appearing several hours after
total occlusion of a coronary artery result from the necrosis
secondary to the decreased blood supply. The number of cells
has to be large enough so as to produce changes reflected at
the body surface. In general, the depth of the Q wave is proportional
to the wall thickness involvement. Thus, in leads1 and V4-6,
a QS complex reflects transmural necrosis. The duration of the
Q wave is proportional to the extent of the area of necrosis
parallel to the epicardial surface. If the latter starts in
the subendocardium and extends toward (but not quite reaching)
the epicardium, the corresponding leads will record QR or Qr
complexes depending on the amount of living tissue located between
thedead tissue and the recording electrode.
In the course of the clinical entity known as
acute MI persisting Q waves are usually due to anatomia necrosis.
Abnormal Q waves can occur in unstable angina, Prinzmetal's
angina,coronary spasm (without chest pain), and exercise induced
angina. Spontaneous recanalization of an occluded vessel, spontaneous
reversion of the ischemia, or spasm and interventions that improve
cellular metabolism and oxgenation can restoe the normal polarizatio.
If these cells becomeexcitable, the abnormal Q waves may disappear
or vanish.
Q waves that persist for more than one day may result from other
causes than necrosis. Profound and prolonged ischemia can cause
myocardial stunning with reversible functional, metabolic, ultrastructura,
and electeophysiologic abnormalities. Thus, transient Q waves
may be the electrocardiographic counterpart of the corresponding
mechanical stunning. Myocardial hibernation refers to mechanical
dysfunction of an ischemic area that is not transient but chronic.
Finally, abnormal Q waves may be due to primary (due to drugs
or infection) cellular necrosis with normal coronary arterie
and inother pathological processes such as myocardial infiltration
and certain types of interventricular septal hypertophy.
| DEFINITION: ISCHEMIC
T-WAVE CHANGES |
Symmetrical T waves, upright or inverted as in figure 94-4 above, characteristic of electrocardiographic 'ischemia', are due to cellular affection resulting in prolongation of the action potential reflected in the QT interval.
The picture below, figure 94-4b, representing hyperacute ischemia shows tall, broad based T waves, which are not narrow and pinched together to a point at the apex or top of their height, as they are in hyperkalemia (see figure 94-28a).
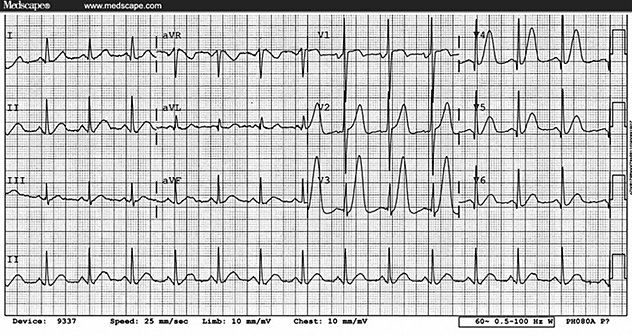
Figure 94-4b
| DEFINITION: SECONDARY
ST-T -WAVE CHANGES |
Alterations in the sequence of ventricular depolarization
(as those produced by bundle branch block (see figure
94-5), ventricular pacing, ectopic ventricular impulse formation,
preexcitation syndromes, and ventricular hypertrophy) result
in a change in the sequence of ventricular repolarization. The
latter causes nonischemic T-wave inversions (secondary T-wave
changes) in leads showing a predominantly positive QRS deflection.
| CLASSIC PATTERN
OF ACUTE Q-WAVE MI |
This is said to occr in around 50 to 75 percent
of patients with the clinical diagnosis of acute MI.The initial
changes also depend on the moment at which the ECG is recorded,
in reference to the moment of occurrence of the infarction.
Thus, the first ECG change is usually an abnormal T wave. The
T wave may be increased in magnitude, prolonged, and either
positive or negative. A straightening of the normal upward concavity
of the ST segment also has been reported. In mostcases, the
first ECG shows abnormal ST segment elevation and an increase
in the R wave in leads exploring the affected area (figure
94-2). Subsequently, a Q wave appears, usually while the
ST segment is elevated and generally before the T wave becomes
negative. Thereafter the R wave becomes smaller and, as the
ST segment returns to baseline, symmetrical T waves evolve.
| LOCATION OF SITE
OF Q-WAVE MI |
Table 1 shows the location of the leads in which
abnormal Q waves appears. It has to be understood, when classifying
the location of an MI by the leads where abnormal Q waves occur,
that the "affected" zone produced by the occlusion
or spasm of a given vessel may and in fact does, extend beyond
the the area of necrosis to one with injury alone. In other
words, the region where normal Q waves and abnormal ST-sgment
elevation are present is not one to which the necrosis or infarction
is extended, but it is part of the originally affected zone.
RECIPROCAL ST-SEGMENT CHANGES
In an inferior MI with abnormal Q waves and
ST-segment elevation limited to this wall (that is without "affectation"
of the posterobasal, or true posterior, wall), the reciprocal
ST-segment changes will occur in diametrically opposed leads
located in the same plane. For example, "indicative ST
elevation in leads 1 and AVF, which record the electrical activity
of the inferior (posteroinferior, or diaphramatic) wall, yields
"reciprocal ST- segment depressionin leads 1 and AVL because
they face the superior (anterolateral) wall (figs. 94-2 and 94-6, left).
For this reason, an inferior wall "injury"
not affecting the posterobasal wall cannot produce "reciprocal"
changes in a lead, such as V2, which is located in a plane perpendicular
to the frontal plane. The perpendicularity between vertical
lead AVF and horizontal lead lead V2 can best be seen in a left
sagittal plane where lead AVF faces the inferior wall and leadV2
the anterseptal and posterobasal walls (fig. 94-6).
NON-Q-WAVE MI
The "typical" pattern of non-Q-wave
MI consist of abnormal ST-segment depression in all leads except
AVR, which shows ST-segment elevation (fig. 94-7).
These changes usually persist for several days rather than disappearing
in minutes or hours, like in the transitory ST changes of syndromes
of coronary ischemia.The diagnosis takes into consideration
the clinical, enzymatic findings as well as the above plus the
ischemic T-wave changes, nonspecific ST-T wave changes, or rarely
a normal ECG.
RIGHT VENTRICULAR MI
An ST-segment elevation of at least 1mm in lead
V4R in patients with acute inferior MI has a sensitivity of
100 percent, a specificity of 87 percent, and a predictive accuracy
of 92 percent for the diagnosis of right ventricular infarction
(fig. 94-8).
These changes disappear within 10 to 18h after the onset of
chest pain in 50 percent of patients and after 72h in the remaining
patients.
The majority of patients with acute inferior
infarction have abnormal regional function of the right ventricle.
The incidence of right ventricular infarction in patients with
obstruction of the right coronary artery and inferior infarction
is in the 70 to 80 percent range. Occasionally, patients may
have predominantly right ventricular involvement and exhibit
right ventricular failure with signs of systemic congestion
without pulmonary congestion. The infarction usually involves
the posterior septum and posterior wall rather than the right
ventricular free wall, which receives blood not only from the
right coronary artery but also the conus artery and the septal
branches of the left anterior descending artery.
These patients frequently require additional
fluid to maintain adequate cardiac output. Diuretics and vasodilators
may aggravate the volume status. Severe right ventricular dysfunction
is uncommon.
Echocardiograhic studies may show a dilated
right ventricle, which may have regional dysfunction, and abnormal
motion of the atrial septum.
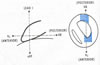
LEFT ANTERIOR FASCICULAR BLOCK
In left anterior fascicular block, the posteroinferior
regions of the left ventricular endocardium are activated abnormally
before the anterosuperior left ventricular area. After emerging
from the posteroinferior division of the left bundle branch,
the impulse first propagates in an inferior, rightward, and
usually anterior direction for a short period of time. This
orientation is responsible for the small q waves in leads1 and
AVL and for the r waves in leads 11, 111, and AVF (fig. 94-9).
Occasionally, small q waves are not present
in leads 1 and AVL. In the absence of MI, these initial QRS
abnormalities have been attributed to "anatomic clockwise
rotation of the heart" or to coexiting septal fibrosis
or to incomplete LBBB. The latter cannot explain a similar orientation
of the vectors when LAFB is present with "complete"
right bundle branch block (RBBB) because ventricular activation
cannot be a function of the "completely" blocked right
branch. In these cases, diffuse septal fibrosis or anatomic
clockwise rotation appear more probable. In pure LAFB, the general
direction of the activation process (which determines the direction
of the EA) occurs in a superior and leftward direction. Consequently,
the fascicles of the left branch behave more as if they were
"superior" and "inferior" rather than "anterior"
and "posterior" (figs. 94-9, 94-10).
The degree of left axis deviation required for
the diagnosis of complete LAFB is for the EA to be least -45
degrees or greater (fig. 94-10
tab2 and fig. 94-10
tab3 ).
When LAFB coexist with certain congenital types
of right ventricular enlargement and extensive anterolateral
MI, the EA can be shifted to the "undeterminate" (right
superior) quadrant (fig. 94-11).
Thus, the constant feature of the axis deviation produced by
LAFB is its superior orientation, not its superior and leftward
orientation (abnormal left axis deviation).
The appearance of LAFB does not increase QRS
duration by more than 0.025s due to multiple interconnections
between the fascicles of the left bundle. Thus, LAFB pattern
with a prolonged QRS duration indicates the presence of additional
conduction disturbances such as RBBB, MI, focal block, or a
combination of these (fig. 94-12).
LEFT POSTERIOR FASCICULAR BLOCK
In pure left posterior fascicular block (LPFB), the impulse
emerges from the unblocked anterosuperior division, thus producing
small q waves in leads II, III, and aVF. Thereafter, the impulse
moves through the electrically predominant left ventricle in
an inferior and rightward direction, thus explaining the S waves
in leads I and aVL as well as the R waves in leads II, III,
and aVF. Radiologic studies of the human heart in situ have
shown that the paraseptal regions of the posteroinferior (diaphragmatic)
surface of the anatomic left ventricle are spatially located
more to the right than certain (anterior) portions of the anatomic
right ventricle. Since the portions of the left ventricle that
are spatially located to the right are less than those located
superiorly, the degree of right-axis deviation produced by pure
LPFB is of lesser magnitude than that of left-axis deviation
produced by LAFB. The hallmark of LPFB, therefore, is an "inferior"
axis shift as much as "right" axis deviation (Figs.1LPFB
to 3LPFB). Because a similar sequence of ventricular activation
also can occur in right ventricular hyper-trophy, pleuropulmonary
disease (acute or chronic), and extremely vertical anatomic
heart positions due to a slender body build or chest wall deformities,
it is evident that the diagnosis of "pure" LPFB cannot
be made from the ECG alone. Additional clinical, radiologic,
or pathologic information is required for this purpose.
See ECG findings below as a summary:
Left Posterior Fascicular Block (LPFB).... Very
rare intraventricular defect!
Right axis deviation in the frontal plane (usually > +100
degrees)
rS complex in lead I
qR complexes in leads II, III, aVF, with R in lead III >
R in lead II
QRS duration usually <0.12s unless coexisting RBBB
Must first exclude (on clinical grounds) other causes of right
axis deviation such as cor pulmonale, pulmonary heart disease,
pulmonary hypertension, etc., because these conditions can result
in the identical ECG picture!
The changes imposed in LPFB by MIs of different
locations are depicted in Figs. Figs.1LPFB to3LPFB below:
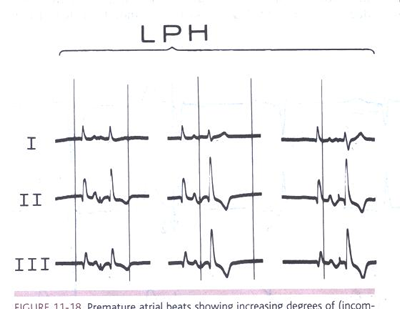
FIGURE 1LPFB Premature atrial beats showing
increasing degrees of (incomplete and complete) LPFB aberration.
The first beats in all panels are escape beats with the same
morphology as that of sinus beats. The second, aberrantly induced
ventricular complexes show different degrees of right-axis shift
with an increase in size of the R waves in leads II and III.
Note that the fundamental characteristic of LPFB was not right-axis
deviation (beyond +90°) but an inferior-axis shift. (From
Castellanos A, Myerburg RJ. The Hemiblocks in Myocardial Infarction.
New York: Appleton-Century-Crofts; 1976. Reproduced with permission
from the publisher and authors.
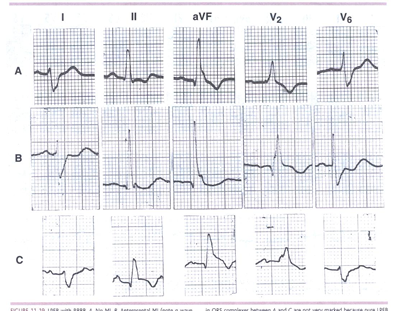
FIGURE 2LPFB. LPFB with RBBB. A. No MI. B. Anteroseptal
MI (note q wave inin V2).C. Inferior MI (note ST-segment elevation
and T-wave inversion in leads II and aVF with slight ST-segment
depression in lead I).The differences in QRS complexes between
A and C are not very marked because pure LPFB
may produce an almost abnormal Q wave in the inferior leads.
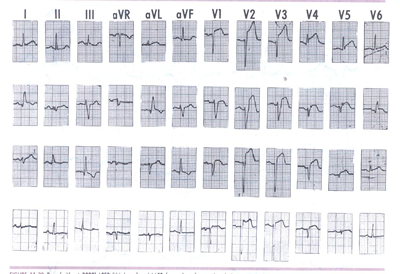
Figure 3LPFB: Pure (without RBBB) LPFB (third
row) and LAFB (second row) occurring during acute anterior wall
MI. Pre- and postfascicular block QRS morphologies are shown
in the top and bottom rows, respectively.
Idiopathic Fascicular Ventricular Tachycardia
Indian Pacing Electrophysiol. J. 2004;4(3):98-103 Editorial
Johnson Francis, MD, DM*, Venugopal K, MD, DM†, Khadar
SA, MD, DM‡, Sudhayakumar N, MD, DM§, Anoop K. Gupta
MD, DM, DNB, FACCll
Abstract:
Idiopathic fascicular ventricular tachycardia is an important
cardiac arrhythmia with specific electrocardiographic features
and therapeutic options. It is characterized by relatively narrow
QRS complex and right bundle branch block pattern. The QRS axis
depends on which fascicle is involved in the re-entry. Left
axis deviation is noted with left posterior fascicular tachycardia
and right axis deviation with left anterior fascicular tachycardia.
A left septal fascicular tachycardia with normal axis has also
been described. Fascicular tachycardia is usually seen in individuals
without structural heart disease. Response to verapamil is an
important feature of fascicular tachycardia. Rare instances
of termination with intravenous adenosine have also been noted.
A presystolic or diastolic potential preceding the QRS, presumed
to originate from the Purkinje fibers can be recorded during
sinus rhythm and ventricular tachycardia in many patients with
fascicular tachycardia. This potential (P potential) has been
used as a guide to catheter ablation. Prompt recognition of
fascicular tachycardia especially in the emergency department
is very important. It is one of the eminently ablatable ventricular
tachycardias. Primary ablation has been reported to have a higher
success, lesser procedure time and fluoroscopy time.
Key words: Ventricular Tachycardia, Structural Normal Heart(as
opposed to left posterior fascicular block discussed above),
Radiofrequency ablation.
Introduction
In general ventricular tachycardias have wide QRS complexes.
One of the earliest descriptions of ventricular tachycardia
(VT) with a narrow QRS complex was by Cohen et al in 1972.1
Their description was a left posterior fascicular tachycardia
with relatively narrow QRS. In 1979, Zipes et al2 reported three
patients with ventricular tachycardia characterized by QRS width
of 120 to 140 ms, right bundle branch block morphology and left-axis
deviation. These patients were young and had no major cardiac
abnormalities. The arrhythmia could be induced by exercise,
atrial and ventricular premature beats as well as atrial pacing
and ventricular pacing. Belhassen et al observed that this tachycardia
can be terminated by the calcium channel blocker verapamil3
This observation has been confirmed subsequently by others as
well.4,5,6,7 Belhassen et al proposed that this is a specific
ECG-electrophysiological entity.8 Fascicular tachycardia has
also been called Idiopathic Left Ventricular Tachycardia (ILVT)
by other authors, though left ventricular outflow tract VT also
comes under the purview of this term.9,10 Fascicular tachycardia
is usually paroxysmal, but a case which was persistent, leading
to cardiac enlargement and complete resolution following therapy
with verapamil has also been reported.4 Termination of idiopathic
fascicular ventricular tachycardia by vagal maneuvers was noted
in 4 cases by Buja et al.11 Successful radiofrequency catheter
ablation was described by Klein et al.12 In this article we
propose to review the current status of our knowledge regarding
the genesis and treatment of idiopathic fascicular ventricular
tachycardia.
Mechanism and Classification
Zipes et al postulated that the origin of the tachycardia
was localized to a small region of reentry or triggered automaticity
located in the posteroinferior left ventricle, close to the
posterior fascicle of the left bundle branch.2 Response to verapamil
suggested a role for the slow inward calcium channel in the
genesis of the arrhythmia. Endocardial mapping during tachycardia
revealed the earliest activation at the ventricular apex and
mid septum.13 The tachycardia can be entrained by ventricular
and atrial pacing. Entrainment by atrial pacing suggests easy
access over the conduction system into the reentry circuit and
hence a role for the fascicles in the reentrant circuit.14 Lau
suggested the origin as reentry circuits involving the lower
septum or posterior part of the left ventricle close to the
endocardial surface in view of the response to radiofrequency
ablation in these sites.15 Purkinje potential recorded in the
diastolic phase during VT at the mid-anterior left ventricular
septum in rare cases with RBBB pattern and right axis deviation
suggested origin near left anterior fascicle in those cases.16
Recently Kuo et al has questioned the involvement of the fascicle
of the left bundle branch in ILVT. 17 They studied two groups
of patients with ILVT. One with left anterior or posterior fascicular
block during sinus rhythm and the other without. They noted
that the transition zone of QRS complexes in the precordial
leads were similar during VT in both groups. New fascicular
blocks did not appear after ablation. Therefore they concluded
that the fascicle of the left bundle branch may not be involved
in the anterograde limb of reentrant circuit in ILVT.
Fascicular tachycardia has been classified into three subtypes:
(1) left posterior fascicular VT (Figure 1) with a right bundle
branch block (RBBB) pattern and left axis deviation (common
form); (2) left anterior fascicular VT with RBBB pattern and
right-axis deviation (uncommon form); and (3) upper septal fascicular
VT with a narrow QRS and normal axis configuration (rare form).18
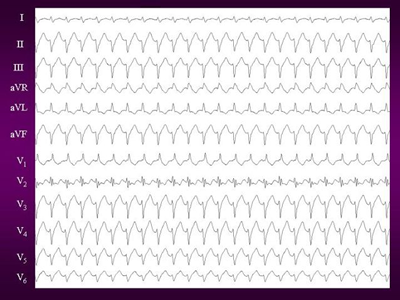
Figure 1. 12 lead ECG of Idiopathic left ventricular tachycardia.
It shows classical RBBB with leftward axis morphology suggestive
of posterior fascicle origin.
Anatomical Substrate
Endocardial activation mapping during VT identifies the earliest
site in the region of the infero-posterior left ventricular
septum. This finding, along with VT morphology and short retrograde
VH interval suggests a left posterior fascicular origin. Nakagawa
and colleagues19 recorded high-frequency potentials preceding
the site of earliest ventricular activation during the VT and
sinus rhythm. These potentials are thought to represent activation
of Purkinje fibers and are recorded from the posterior one third
of the left ventricular septum. Successful RF ablation is achieved
at sites where the purkinje potential is recorded 30 to 40 ms
before the VT QRS complex.
Some date suggest that the tachycardia may originate from a
false tendon or fibro- muscular band that extends from the posteroinferior
left ventricle to the basal septum.20 Histological examination
of false tendon disclosed abundant Purkinje fibers.
Electrophysiological Study
Fascicular tachycardia can be induced by programmed atrial
or ventricular stimulation in most cases. Isoprenaline infusion
may be required in certain cases; rarely there may be difficulty
in induction despite isoprenaline infusion. Endocardial mapping
identifies the earliest activation in the posteroapical left
ventricular septum in patients with posterior fascicular tachycardia.
A high frequency potential with short duration, preceding the
QRS has been described as the Purkinje potential (Figure 2).
This has also been called P potential and diastolic potential.
P potentials can be recorded both in sinus rhythm and during
ventricular tachycardia. Pacing at sites manifesting the earliest
P potential produces QRS complexes identical to that of the
clinical tachycardia.19
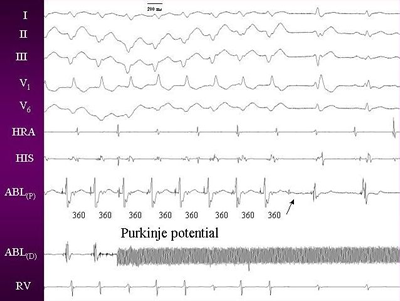
Figures 2. Intracardia electrogram during tachycardia showing
purkinje potential, which persisted after the ablation also
(arrow).
Pharmacological Therapy
Intravenous verapamil is effective in terminating the tachycardia.
However the efficacy of oral verapamil in preventing tachycardia
relapse is variable. Good response and resolution of tachycardiomyopathy
with verapamil treatment was noted by Toivonen et al4, while
Chiaranda et al commented on the poor efficacy.21 Treatment
with propranolol has also resulted in cure of arrhythmia and
resolution of features of tachycardiomyopathy in another case
with incessant fascicular VT.22 Though fascicular tachycardias
do not generally respond to adenosine, termination of VT originating
from the left anterior fascicle by intravenous adenosine has
been documented.23
Catheter Ablation
The young age of most patients with need for long-term antiarrhythmic
treatment and attendant side effects prompted the search for
curative therapies. Fontaine et al (1987) described successful
treatment of ILVT by application of a high-energy DC shock (fulguration)
between the catheter tip and a neutral plate placed under the
patient's back.24 Klein et al (1992) reported cure of ILVT by
radiofrequency catheter ablation.25 Since then radiofrequency
has remained the procedure of choice.
Different approaches for radiofrequency ablation have been described
by various authors. Nakagawa et al preferred careful localization
of the Purkinje potential in guiding ablation. They selected
the area where a Purkinje potential precedes the QRS complex
during tachycardia.19 Wellens et recommend pace mapping with
a match between the 12 simultaneously recorded ECG leads during
pacing and the clinical tachycardia for localizing the site
of ablation.9 They hypothesize that pathways within the Purkinje
network that are not included in the reentry circuit responsible
for the tachycardia may also become activated. Ablation of those
regions may not result in interruption of the tachycardia circuit.
Primary Radiofrequency Ablation
Since fascicular VT is sometimes difficult to induce despite
pharmacological provocation, some workers (Gupta et al) prefer
primary ablation. In a recent report, seven cases of incessant
fascicular VT were successfully ablated with no recurrence.26
They reported a shorter procedure time, significantly lower
fluoroscopy time and lesser number of radiofrequency energy
deliveries in the primary versus elective groups. The longer
procedural time during elective ablation was mainly due to the
time spent in induction of fascicular VT.
References
1. Cohen HC, Gozo EG Jr, Pick A. Ventricular tachycardia with
narrow QRS complexes (left posterior fascicular tachycardia).
Circulation. 1972 May; 45(5): 1035-43.
2. Zipes DP, Foster PR, Troup PJ, Pedersen DH. Atrial induction
of ventricular tachycardia: reentry versus triggered automaticity.
Am J Cardiol. 1979; 44:1-8.
3. Belhassen B, Rotmensch HH, Laniado S. Response of recurrent
sustained ventricular tachycardia to verapamil. Br Heart J.
1981 Dec; 46(6): 679-82.
4. Toivonen L, Nieminen M. Persistent ventricular tachycardia
resulting in left ventricular dilatation treated with verapamil.
Int J Cardiol. 1986; 13(3): 361-5.
5. Tai YT, Chow WH, Lau CP, Yau CC. Verapamil and ventricular
tachycardias. Chin Med J (Engl). 1991 Jul; 104(7): 567-72.
6. Ward DE, Nathan AW, Camm AJ. Fascicular tachycardias sensitive
to calcium antagonists. Eur Heart J. 1984;5:896-905.
7. Sethi KK, Manoharan S, Mohan JC, Gupta MP. Verapamil in
idiopathic ventricular tachycardia of right bundle-branch block
morphology: observations during electrophysiological and exercise
testing. Pacing Clin Electrophysiol. 1986;9:8-16.
8. Belhassen B, Shapira I, Pelleg A, Copperman I, Kauli N,
Laniado S. Idiopathic recurrent sustained ventricular tachycardia
responsive to verapamil: an ECG-electrophysiologic entity. Am
Heart J. 1984 Oct; 108(4 Pt 1): 1034-7.
9. Wellens HJJ, Smeets JLRM. Idiopathic Left Ventricular Tachycardia:
Cure by Radiofrequency Ablation. Circulation. 1993; 88(6): 2978-2979.
10. Thakur RK, Klein GJ, Sivaram CA et al. Anatomic Substrate
for Idiopathic Left Ventricular Tachycardia. Circulation. 1996;93:497-501.
11. Buja G, Folino A, Martini B et al. Termination of idiopathic
ventricular tachycardia with QRS morphology of right bundle
branch block and anterior fascicular hemiblock (fascicular tachycardia)
by vagal maneuvers. Presentation of 4 cases. G Ital Cardiol.
1988 Jul; 18(7): 560-6.
12. Klein LS, Shih H, Hackett FK, Zipes DP, Miles WM. Radiofrequency
catheter ablation of ventricular tachycardia in patients without
structural heart disease. Circulation. 1992;85:1666-1674.
13. German LD, Packer DI, Bardy GH, Gallagher JJ. Ventricular
tachycardia induced by atrial stimulation in patients without
symptomatic cardiac disease. Am J Cardiol. 1983;52:1202-1207.
14. Okumura K, Matsuyama K, Miyagi II, Tsuchlya T, Yasue H.
Entrainment of idiopathic ventricular tachycardia of left ventricular
origin with evidence for re-entry with an area of slow conduction
and effect of verapamil. Am J Cardiol. 1988;62:727-732.
15. Lau CP. Radiofrequency ablation of fascicular tachycardia:
efficacy of pace-mapping and implications on tachycardia origin.
Int J Cardiol. 1994 Oct; 46(3): 255-65.
16. Nogami A, Naito S, Tada H et al. Verapamil-sensitive left
anterior fascicular ventricular tachycardia: results of radiofrequency
ablation in six patients. J Cardiovasc Electrophysiol. 1998
Dec; 9(12): 1269-78.
17. Kuo JY, Tai CT, Chiang CE et al. Is the fascicle of left
bundle branch involved in
the reentrant circuit of verapamil-sensitive idiopathic left
ventricular tachycardia? Pacing Clin Electrophysiol. 2003 Oct;
26(10): 1986-92.
18. Nogami A. Idiopathic left ventricular tachycardia: assessment
and treatment. Card Electrophysiol Rev. 2002 Dec; 6(4): 448-57.
19. Nakagawa H, Beckman KJ, McClelland JH, et al. Radiofrequency
catheter ablation of idiopathic left ventricular tachycardia
guided by a Purkinje potential. Circulation. 1993;88:2607-2617.
20. Kudoh Y, Hiraga Y, Iimura O. Benign ventricular tachycardia
in systemic sarcoidosis--a case of false tendon. Jpn Circ J.
1988 Apr; 52(4): 385-9.
21. Chiaranda G, Di Guardo G, Gulizia M, Lazzaro A, Regolo
T. Ital Heart J. 2001 Nov; 2(11 Suppl): 1181-6.
22. Anselme F, Boyle N, Josephson M. Incessant fascicular tachycardia:
a cause of arrhythmia induced cardiomyopathy. Pacing Clin Electrophysiol.
1998; 21: 760-3.
23. Kassotis J, Slesinger T, Festic E, Voigt L, Reddy CV. Adenosine-sensitive
wide-complex tachycardia: an uncommon variant of idiopathic
fascicular ventricular tachycardia--a case report. Angiology.
2003 May-Jun; 54(3): 369-72.
24. Fontaine G, Tonet JL, Frank R et al. Treatment of resistant
ventricular tachycardia by endocavitary fulguration associated
with anti-arrhythmic therapy. Eur Heart J. 1987 Aug; 8 Suppl
D: 133-41.
25. Klein LS, Shih H, Hackett FK, Zipes DP, Miles WM. Radiofrequency
catheter ablation of ventricular tachycardia in patients without
structural heart disease. Circulation. 1992;85:1666-1674.
26. Gupta AK, Kumar AV, Lokhandwala YY et al. Primary radiofrequency
ablation for incessant idiopathic ventricular tachycardia. Pacing
Clin Electrophysiol. 2002 Nov; 25(11): 1555-60.
Complete RBBB
A " complete RBBB pattern (with QRS duration
> 0.11s) does not necessarily reflect the existence of a total
conduction block in the right branch. This pattern only indicates
that the entire or major parts of both ventricles are activated
by the impulse emerging from the left branch. Thus, a significant
degree of conduction delay ("high-grade" or "incomplete RBBB)
can produce a similar pattern.
In pure complete RBBB, the EA should not be
deviated abnormally either to the left or to the right. These
axis deviations reflect coexisting fasicicular block or right
ventricular hypertrophy.
Causes of RBBB Pattern
BBB is rarely a clinical problem of any consequence
except when the block occurs simulanteously in both branches.
Causes of the RBBB include the following:
1. Surgical
trauma from a heart operation for congenital heart diseases
like a ventricular septal defect, atrial septal defect and use
of catheters etc.
2. A disease
which interrupts the heart fibers like a prior heart attack
(myocardial infarction) causing fibrosis.
3. Chronic
lung disease (cor pulmonale)
4. Elongation
of the right bundle due to a congenital volume overload of the
right ventricle(stretched or dilated)
5. Age associated
predisposition in the elderly to sinus node dysfunction, abnormal
conduction in the AV node, His-Purkinje system, and inthe bundle
branches.
6. Sarcoidosis,
rheumatic fever, amyloiosis, systemic lupus erythematosis, gout,
familial heart block etc.
Reference:Castellanos,A. and others,Hurst's
The Heart 8th Edition,The Resting Electrocardiogram,321-356.
Incomplete RBBB Pattern
Incomplete RBBB patterns can be produced by
the following mechanisms
(1) different degrees of conduction
delays through the main trunk of the right bundle branch (fig. 94-17);
(2) an increased conduction
time through an elongated right bundle branch that is stretched
because of a concomitant enlargement of the septal surface (as
in congenital volume overload of the right ventricle);
(3) a diffuse Purkinje-myocardial
delay due to right ventricular stretch or dilatation;
(4) surgical trauma or disease-related
interruption of the major ramifications of the right branch
("distal" RBBB or "right fascicular blocks"); or
(5) congenital variations of
the distribution of the major ramifications resulting in a slight
delay in the activation of the crista supraventricularis.
Reference:Castellanos,A. and others,Hurst's
The Heart 8th Edition,The Resting Electrocardiogram,321-356.
Concealed RBBB
A conduction delay in the main trunk of the
right bundle or in its major ramifications may be concealed
(not manifested in the surface ECG) when there are coexisting
(and of greater degree) conduction disturbances in the main
left bundle branch, the anterosuperior division of the left
bundle branch and/or the free left ventricular wall.
A RBBB can also be concealed in some patients
with Wolff-Parkinson-White syndrome if the ventricular insertion
of the accessory pathway causes preexcitation of the right ventricular
regions that would be activated late because of the RBBB.
Reference:Castellanos,A. and others,Hurst's
The Heart 8th Edition,The Resting Electrocardiogram,321-356.
Complete LBBB
This conduction disturbance is characterized
by wide (greater than 0.11s) QRS complexes. The diagnostic criteria
consist of prolongation of the QRS complexes (over 0.11s) with
neither a q wave nor an S wave in lead V1 and in the "properly
placed" V6. A wide R wave with a notch on its top ("plateau")
is seen in these leads. In hearts with an electrical (and anatomic)
vertical position a small Q wave may be seen in AVL in the absence
of MI. Right chest lead V1 may or may not show an initial r
wave, but the latter should be present in lead V2. Unfortunately,
as mentioned in reference to complete RBBB, a complete LBBB
form can be recorded in patients with high degree (not necessarily
complete) LBBB. The direction of the electrical axis in patients
showing QRS changes typical of complete LBBB has also been widely
discussed.
In the majority of the human hearts, the site of exit from the
right bundle branch does not seem to be at the lowermost right
ventricular region (that called in pacemaker nomenclature the
right ventricular apex). If this were the case, all complete
LBBBs would show (as when the right ventricular apex is paced)
abnormal left axis deviation whereas the electrical axis in
"uncomplicated" complete LBBB block usually is not located beyond
-30 degrees.
Reference: Castellanos, A. and others,
Hurst's The Heart 8th Edition, The Resting Electrocardiogram,321-356.
Complete LBBB with MI
Normally, in complete LBBB, the impulse emerges
from the right bundle branch and propagates to the left and
slightly anteriorly. This orientation of the initial forces
tend to abolish previously present inferiorly and laterally
located abnormal Q waves characteristic of inferior and lateral
MI. If the infarction is anteroseptal, however, the impulse
cannot propagate toward the left. Instead, the initial vectors
point toward the free wall of the right ventricle because now
the right ventricular free-wall forces are not neutralized by
the normally preponderant septal and/or initial left ventricular
free Thus, a -wall forces. Thus, a small q wave will be recorded
in leads (1, V5, and V6) where it is not normally recorded in
complete LBBB (Fig. 94-18).
The most sensitive sign to detect acute MI is
ST-segment elevation in leads facing the affected region (Fig. 94-19).
Reference: Castellanos,A. and others,
Hurst's The Heart 8th Edition, The Resting Electrocardiogram,321-356.
Incomplete LBBB Pattern
An incomplete LBBB pattern can be diagnosed
in a heart with an electrically horizontal (or semihorizontal)
heart position when leads 1 and V6 show an R wave with a slurring
in its upstroke ( not on its top, as incomplete LBBB). Lead
V1 shows Rs or QS complexes, and lead V2 shows Rs complexes.
Although QRS duration usually ranges between 0.o8 and 0.11s
, this pattern can be observed with QRS durations of 0.12 and
0.13s.
Not surprisingly, an incomplete LBBB pattern
can be produced by various processes, including the following
(1) conduction delays in the
main trunk of the left bundle branch,
(2) conduction delays (of more
or less equal degree) in the fascicles of the left bundle branch,
(3) diffuse septal fibrosis,
(4) small septal infarcts,
(5) left ventricular enlargements
(generally due to pressure overloading) in patients with congenital
heart disease, and
(6) combinations of all of the
above.
Reference: Castellanos,A. and others,
Hurst's The Heart 8th Edition, The Resting Electrocardiogram,321-356.
Wide QRS Complexes in Patients with Manifest
Preexcitation Syndromes
The characteristic pattern of manifest Wolff-Parkinson-White
syndrome consists of a short PR interval (reflecting faster
than normal conduction through an accessory pathway of the Kent
bundle type) preceding a wide QRS complex. The latter usually
shows an initial slurring (delta wave) followed by a terminal,
slender part. The classical ventricular complex is a fusion
beat resulting from ventricular activation by two wave fronts.
One, traversing the accessory pathway, produces the delta wave.
The other, emerging from the normal pathway, is responsible
for the terminal, more normal parts of the QRS complex.
The degree of preexcitation (amount of muscle
activated through the accessory pathway) depends on many factors.
Foremost among these are the distance between the sinus node
and atrial insertion of accessory pathway and, more important,
the differences in conduction time through the normal pathway
and accessory pathway.
Other things being equal, a patient with rapid
(enhanced) AV nodal conduction will have a smaller delta wave
than a patient with slow conduction through the AV node. Moreover,
if there is total block at the AV node or His-Purkinje system,
the impulse will be conducted exclusively via the accessory
pathway. When this occurs, the QRS complexes are no longer fusion
beats, since the ventricles are then activated exclusively from
the preexcited site. Consequently, the delta wave disappears
and the QRS complexes are different than fusion beats, though
the direction of the delta wave remains the same.
Moreover, the QRS complexes are as wide as (and
really simulating) those produced by artificial or spontaneous
beats arising in the vicinity of the ventricular end of the
accessory pathway.
Also of importance are the characteristics of
the QRS complexes of beats without preexcitation in relationship
to the characteristics of beats resulting from exclusive accessory
pathway conduction (which in turn depends on the location of
the pathway). Not surprisingly, the EA can show marked changes
when fusion beats are compared with pure peexcited beats (figure 94-20).
There are three major methods available for
the anatomic localization of accessory pathways, namely intra
operative mapping, catheter electrode techniques, analysis of
the 12-lead ECG (least accurate but the easiest).
Left free-wall accessory pathways are characterized
by negative or isoelectric delta waves in one of leads 1, AVL,
V5 or V6. Lead V1 shows RS or R complexes (fig. 94-20).
During sinus rhythm, the electrical axis may be normal, but
when atrial fibrillation develops and elusive accessory pathway
conduction occurs, the EA is deviated to the right and inferiorly
(figure 94-20).
Posteroseptal accessory pathways show negative
or ioselectric delta waves in two of LEADS 11, 111, or AVF and
RS (or R) waves in V1,V2, or V3 (figure 94-21).
An Rs (or RS) wave in V1 suggests left paraseptal
pathway; a QS complex in the same lead may correspond to a right
paraseptal pathway.
Right free-wall accessory pathways display an
LBBB pattern defined, for purposes of accessory pathway localization,
by an R wave greater than 0.09s in lead 1 and rS complexes in
leads V1 and V2 with an EA ranging between+30 degrees to - 60
degrees (fig. 94-22).
The most rare right anteroseptal accessory
pathways show an LBBB pattern with an EA between +30 degrees
and +120 degrees (fig. 94-23).
A q wave may be present in lead AVL but not in leads 1 orV6.
Mixed patterns may result from the existence
of two separate accessory pathways.
Reference: Castellanos,A. and others,
Hurst's The Heart 8th Edition, The Resting Electrocardiogram,321-356.
LEFT ATRIAL HYPERTROPHY
Clues to left atrial hypertrophy include (1)
P-wave duration greater than 0.11 s and notched P wave with
an interpeak interval in excess of 0.04 s and (2) negative phase
of P in V1 longer than 0.04 s and greater than 1 mm in lead
VI. These criteria apply to intraatrial block actually, and
if found in patients with left ventricular enlargement or mitral
stenosis, then left atrial hypertrophy is most likely present.
The ECG pattern of left atrial hypertrophy results from a hypertrophy-
induced intraatrial conduction delay.
Reference: Castellanos,A. and others,
Hurst's The Heart 8th Edition, The Resting Electrocardiogram,321-356.
LEFT VENTRICULAR HYPERTROPHY (LVH)
As emphasized by Surawicz,
since the advent of other noninvasive techniques, there has
been a changing role for the ECG in the diagnosis of ventricular
hypertrophy. Necropsy studies have exposed the superiority of
echocardiography with respect to electrocardiography to detect
LV hypertrophy. Echocardiography is also a better method for
the serial follow-up of changes during progression or regression
of LV hypertrophy. Multiple criteria have been proposed to diagnose
LV hypertrophy using necropsy or echocardiographic information
(Table
3 and Table
4). Of these, the Sokolow-Lyon criterion (SV1 + RV5,6 _35
mm) is the most specific (>95 percent) but is not very sensitive
(45 percent) (see Table
4). The Romhilt-Estes score has a specificity of 90 percent
and a sensitivity of 60 percent in studies correlated with echocardiography.
The following are some of the other criteria49: The Casale (modified
Cornell) criterion (Ravl + SV, >28 mm in men and >20 in
women) is somewhat more sensitive but less specific than the
Sokolow-Lyon criterion. The Talbot criterion (R _16 mm in avL)
is very specific (>90 percent), even in the presence of MI
and ventricular block, but not very sensitive. The Koito and
Spodick criterion (RV6> RV5) claims a specificity of 100
percent and a sensitivity of more than 50 percent. According
to Hernandez Padial, a total 12-lead QRS voltage of greater
than 120mm is a good ECG criterion of LV hypertrophy in systemic
hypertension and is better than those most frequently used.
With echocardiography as the "gold standard," several
authors postulated ECG criteria for diagnosis of LV hypertrophy
in the presence of complete LBBB and LAFB . The high sensitivity
and specificity reported by Gertsch et al. for diagnosis of
LV hypertrophy with LAFB have not been corroborated in preliminary
studies performed in the department of A.Castellanos and others,Hurst,s
THE HEART,10ty Edition,Chpt.11,p.302.
Reference: Castellanos,A. and others,
Hurst's The Heart 8th Edition, The Resting Electrocardiogram,321-356.
PROCESSES PRODUCING OR LEADING TO RVH
AND ENLARGEMENT
Right ventricular hypertrophy is manifest in
the ECG only when the right ventricular forces predominate over
those of the left ventricle. Since the latter has, roughly,
three times more mass than the former, the right ventricle may
double in size (when the left ventricle is normal) or triple
its weight (when there is significant LVH) and still not result
in the necessary requirements to pull the electrical forces
anteriorly and to the right. For these reasons, RVH cannot be
recognized easily in adult patients.
The ECG manifestations of RVH or enlargement can be divided
into the following three main types :
(1) the posterior and rightward
displacement of QR forces associated with low voltage, as seen
in patients with pulmonary emphysema (fig. 94-24);
(2) the incomplete RBBB pattern
occurring in patients with chronic lung disease and some congenital
cardiac malformation resulting in volume of the right ventricle
(fig. 94-25);
(3) the true posterior wall
myocardial infarction pattern with normal to low voltage of
the R wave inV1 (fig. 94-26);
(4) and the classical right
ventricular hypertrophy and strain pattern as seen in young
patients with congenital heart disease (producing pressure overloading)
or adult patients with high pressure ("primary " pulmonary hypertension)
(fig. 94-27).
False patterns of RVH may occur in patients with true posterior
(basal) MI, complete RBBB with LPFB and Wolff-Parkinson- White
syndrome resulting from AV conduction through the left free
wall, or posteroseptal accessory pathways.
Reference: Castellanos,A. and others,
Hurst's The Heart 8th Edition, The Resting Electrocardiogram,321-356.
ELECTROLYTE IMBALANCES
Because multiple factors can affect ventricular
repolarization in diseased hearts, the finding characteristic
of a specific electrolyte abnormality may be modified, and even
mimicked, by various pathological processes and the effects
of certain drugs. The major problem with the ECG diagnosis of
electrolyte imbalance is not the negative ECG with abnormal
serum values. But the production of similar changes by other
conditions in patients with normal serum values.
Hyperkalemia
The initial effect of acute hyperkalemia is
the appearance of peaked T waves with a narrow base (Fig. 94-28a,
left).The diagnosis of hyperkalemia is almost certain when the
duration of the base is 0.20s or less (with rates between 60
and 110 per minute). As the degree of hyperkalemia increases,
the QRS complex widens with the EA usually being deviated abnormally
to the left, and rarely to the right (Fig. 94-28b). In addition, the PR interval prolongs, and the
P wave flattens until it disappears (Fig. 94-28c).
The effect of hyperkalemia on cardiac rhythm
is complex, and virtually any arrhythmia may be seen. Various
bradyarrhythmias, including impaired AV conduction and complete
AV block, may occur. If untreated, death ensues either due to
ventricular standstill or coarse slow ventricular fibrillation.
Death can also result if wide QSR complexes
(due to hyperkalemia) occurring at fast rates are diagnosed
as ventricular tachycardia and the patient is treated with antiarrhythmic
drugs.
In other circustances, tachycardias may result,
including sinus tachycardia, frequent ventricular extrasystoles,
ventricular tacycardia, and ventricular fibrillation.
The rate of K elevation appears to influence the type of arrhythmia
produced. A slow elevation of K produces widespread block and
depressed automaticity, and rapid infusions produce ventricular
ectopic rhythms and terminally ventricular fibrillation.
Moderate hyperkalemia has been noted to suppress supraventricular
and ventricular ectopic beats in about 80% of patients.
On the other hand, Class1A and ClassC drugs as well as large
doses of tricyclic antidepressants (especially when ingested
for suicide purposes) can also produce marked QRS widening.
These processes, however, do not coexist with narrow-based,
peaked T waves.
Rarely, hyperkalemia produces ( in the absence of coronary artery
disease) a degree of ST-segment elevation in the right chest
leads capable of suggesting anteroseptal myocardial injury (Fig.
94-28d). These constitute the "dialyzable currents of injury
in potassium" reported by Levine et al.
Reference: Castellanos,A. and others, Hurst's
The Heart 8th Edition, The Resting Electrocardiogram, 321-356.
Reference:Rardon,D.F. and Fisch,C.,Electrolytes and the Heart,Hurst's
The Heart, 8th Edition ,Ch.37,759-774.
Hypokalemia
The abnormal and delayed repolarization that
occurs in hypokalemia is best expressed as QU, rather than QT,
prolongation, since at times it can be difficult to differentiate
between notching of the T wave and T- and U- wave fusion. As
the serum potassium falls, the ST-segment becomes progressively
more depressed and there is a gradual blending of T wave into
what appears to be a tall U wave (Fig. 94-29a). Decreased amplitude
of the T wave, an increase in U-wave amplitude, and ST-segment
depression produce a rather characteristic undulating appearance
to the baseline very suggestive of hypokalemia (Fig.
94-29b). When hypokalemia is severe, the QRS complex may
widen slightly in a diffuse manner. The P-wave amplitude may
be increased and the PR interval is often slightly prolonged.
The changes in the ECG correlate with the plasma
K level fairly well,being found in 78% of patients with plasma
K below 2.7 meq/liter, in 35 % of those with K between 2.7 and
3.0 meq/liter, and in10% with K between 3.0 and 3.5 meq/liter.
Hypokalemia promotes the appearance of supraventricular
and ventricular ectopic rhythms, being enhanced by increased
automaticity and/or facilitation of reentry.
The effects of digitalis on the myocardium are
modified by the extracellular K concentration. Digitalis glycosides
inhibit the Na-K-ATPase, increasing intracellular Na and reducing
K. This interrelationship between digitalis and K is manifest
by
(1) depression of digitalis-induced
ectopy by K,
(2) emergence of digitalis-induced
ectopy during hypokalemia, and
(3) enhancement of digitalis-induced
depression of conduction by K.
The major sign of digitalis toxicity is increased
automaticity with extrasystoles or tachycardias (like nonparoxysmal
junctional tachycardia and atrial tachycardia with block), both
of which are potentiated by low serum K. The administration
of K is safe and quite effective in suppressing these arrhythmias.
Because of the differing sensitivities of the
Purkinje and AV junctional tissues to K, there is a significantly
wide margin of safety between the antiectopic and the AV depressant
effects of K. This margin of safety permits judicious administration
of K for control of life-threatening arrhythmias, even in the
presence of simple AV conduction delay.
An ECG pattern similar to that of hypokalemia
can be produced by some antiarrthythmic drugs, especially quinidine.
These quinidine-induced repolarization changes may appear in
patients receiving therapeutic doses who do not have elevated
serum levels. Although at times these changes simply reflect
that the patient is taking the drug, they should be viewed with
extreme caution. When repolarization is greatly prolonged, however,
they lead to multiform ventricular arrhythmias, including the
so-called torsades de pointes (Fig. 6, 7, 9b).
Reference: Castellanos,A. and others, Hurst's
The Heart 8th Edition, The Resting Electrocardiogram,321-356.
Reference:Rardon,D.F. and Fisch,C.,Electrolytes and the Heart,Hurst's
The Heart, 8th Edition ,Ch.37,759-774.
Hypomagnesemia
Hypomagnesemia does not produce QU prolongation
unless the coexisting hypokalemia (with which it is almost invariably
associated) is severe. Long-standing and very marked magnesium
deficiency lowers the amplitude of the T wave and depresses
the ST-segment. It is difficult to differentiate between the
changes produced by magnesemia from those produced by potassium.
Elevation of extracellular Mg to a level of 6 to 10 meq/l depresses
AV and intraventricular conduction. Sinoatrial and AV block
occur at 15 meq/l, and cardiac arrest may be expected at levels
of 15 to 22 meq/l.
Hypomagnesemia may predispose to digitalis toxicity.
Administration of intravenous magnesium sulfate
to patients with prolonged QT intervals and torsades de pointes,
whether the initial Mg level is normal or low, may suppress
the ventricular arrhythmia.
Reference: Castellanos,A. and others, Hurst's
The Heart 8th Edition, The Resting Electrocardiogram,321-356.
Reference:Rardon,D.F. and Fisch,C.,Electrolytes and the Heart,Hurst's
The Heart, 8th Edition ,Ch.37,759-774.
Hypercalcemia
During sinus rhythm with normal rates the QT
interval is short (Fig. 94-29a bottom). If factors known to
modify the QT are not present, it has been said that a reasonably
accepted correlation exist between the duration of the interval
and serum calcium levels. The primary manifestation of hypercalcemia
is a marked decrease in the duration of the ST segment. The
Twave may actually begin at the end of the QRS complex, and
virtually no ST segment may be present. This change produces
a decrease in the length of the QTc interval. There is a lack
of correlation QTc and serum calcium. The interval from the
qt to the apex of the T wave can be measured most precisely
and shows the best correlation with the Ca level (Fig. 94-29c).
First degree AV block may be seen. Cardiac arrhythmias secondary
to hypercalcemia are unusual.
Occasionally, the ST segment is depressed and the T waves may
become inverted in the left and the right ventricular chest
leads.
Digitalis also shortens the QT interval but
produces its characteristiac "effects" in leads where the R
wave predominate. The classical upward concavity of the ST segment
is seen in the left chest leads in patients with LVH and in
V1 and V2 when there is RVH (with predominantly positive deflections
in these leads).
Reference: Castellanos,A. and others, Hurst's
The Heart 8th Edition, The Resting Electrocardiogram,321-356.
Reference:Rardon,D.F. and Fisch,C.,Electrolytes and the Heart,Hurst's
The Heart, 8th Edition ,Ch.37,759-774.
Hypocalcemia
The typical ECG pattern of hypocalcemia consists
of QT prolongation due to ST segment prolongation.The QTc rarely
exceeds 140% of normal. If hte QT exceeds that number, the U
wave is likely to be included in the measurement.
The T wave is usually of normal width but can be narrow based
if there is coexistent (moderate) hyperkalemia (Fig. 94-30a),
most often seen in patients with chronic renal failure (Fig. 94-30b). A very marked subendocardial
ischemia (with the so-called hyperacute ST-T changes) can produce
a similar pattern, but in those cases the T wave, though peaked,
is not as narrow based.
Similarly, hypocalcemia in association with a terminal wave
consisting of both the T and the U waves. While the ST segment
is prolonged, the total QU interval remains normal.
It has been said that hypocalcemia per se does not produce T
wave inversion. When present, the latter is usually a reflection
of coexisting processes such as LVH and incomplete LBBB.
An ECG pattern similar to that of hypocalcemia can be produced
by organic abnormalities of the central nervous system and by
congenitally prolonged QT intervals such as the Jervell and
Lange-Nielsen and Romano-Ward syndromes.
Reference: Castellanos,A. and others,
Hurst's The Heart 8th Edition, The Resting Electrocardiogram,321-356
Reference:Rardon,D.F. and Fisch,C.,Electrolytes and the Heart,Hurst's
The Heart, 8th Edition ,Ch.37,759-774.
Lithium
Lithium is important in cardiac electrophysiology
because of its wide use in the management of depressive disorders.
Reversible T- wave changes are the most common ECG abnormality
due to lithium. Dysfunction of the SA node is the characteristic
and clinically significant complication of Li therapy. Disordered
sinus node function may be manifested by sinus bradycardia,
SA arrest, or exit block, either type 1 (Wenckebach) or type
11 (Mobitz 11) (see definition of sinus
bradycardia, figures 16, 17, exit block, atrioventricular
conduction disturbances, figures 84-92 on this website). These
side effects occur most often within the therapuetic range.
The effect of lithium on SA node appears to be selective as
suggested by a normal PR, a normal QRS, and in the HIS electrogram,
a normal AH with only slightly prolonged HV interval.
Reference: Castellanos,A. and others,
Hurst's The Heart 8th Edition, The Resting Electrocardiogram,321-356
Reference:Rardon,D.F. and Fisch,C.,Electrolytes and the Heart,Hurst's
The Heart, 8th Edition ,Ch.37,759-774.
Long QT syndrome (LQTS)
This is an inherited disorder ot cardiac repolarization,
characterized by ECG
abnormalities, syncopal attacks and risk of sudden death due
to ventricular
tachyarrhythmias such as torsade de pointes (figure 13, see
definition of
ventricular
tachycardia on this website). The LQTS may occur as an
autosomal dominantly inherited form (Romano-Ward syndrime, RWS),
or as a
part of the autosomal recessively inherited Jervell and Lange-Nielson
syndrome (JLSN) in which prolongation of the QT interval is
assoociated with
sensorineural deafness. The LQTS is associated with significant
morbidity
and mortality, with estimated annual rates of 5% and 1% for
syncope and
death, respectively. A recent study found a single missense
mutation of the
KCNQ1 gene (a potassium channel gene) accounting for 30% of
Finnish
cases with the LQTS, which may be associated with both the RWS
and JLNS
phenotypes of the syndrome.
Reference:Piipo,K, and others,A founder
mutation of the potssium
channelkcnq1 in long qt syndrome,JACC,Vol.,37,No.2,2001,562-567.
DELAYED REPOLARIZATION SYNDROMES
Although it is not always easy to differentiate
between prolonged QT and QU intervals, determining the existince
of prolonged repolarization is not difficult, especially if
indeterminate (V3 and V4) chest leads are analyzed. For these
reasons, it has been recommended that the single, more comphrensive,
delayed depolarization syndrome be used (Table 5). In these
cases, long strips should be obtained since the duration of
the depolarization, though greater at slower rates (or longer
cycle lengths) as well as under normal conditions, differs from
the latter in the magnitude of its brady cardia dependency.
Reference: Castellanos,A. and others, Hurst's
The Heart 8th Edition, The Resting Electrocardiogram,321-356.
Hypothermia
Characteristic ECG changes develope when the
body temperature drops to approsimately 30 degreesC. In addition,
deflection, called the Osborn wave, appears in a place said
to be located between the end of the QRS complex and the beginning
of the ST segment (fig. 94-31).
This deflection has been attributed to delayed depolarization.
In leads facing the left ventricle, the deflection is positive
and its is inversely related to body temperature.
Brugada Syndrome
Brugada syndrome, a primary electrical disease
of the heart, is characterized by a pattern of RBBB and ST-segment
elevation in electrocardiogram (ECG) leads V1-V3 (Figures 94-32, 94-33) and caused by a defect
in ion channel genes, resulting in abnormal electropysiological
activity in the right ventricle and propensity to malignant
tachyarrhythmias. It occurs particularly frequently in Asian
countries.
The mechanisms responsible for the arrhythmogenesis
in this syndrome are currently unknown. Recent studies have
linked the pathogenesis of the ECG manifestations of this syndrome
to heterogeneous loss of the action potential dome, causing
a marked epicardial and transmural disperion of repolarization,
which may result in the production of ST-segment elevation,
thus giving rise to phase 2 re-entry. These observations support
the hypothesis that the mechanism of malignant ventricular arrhythmias
(Figure 94-34)
in this syndrome is caused by repolarization abnormality.
Another explanation of arrhythmogenesis in this
syndrome is the presence of delayed conduction in the right
ventricle,which may support the conduction abnormality hypothesis.
It has been found that the late potential (LP) detected by signal
average ECG (Figure 94-34) is
a noninvasive risk stratifier in these patients.
Nevertheless, electrophysiologic testing--including provocative
tests of induciblity of VT/VF and drug effects on:
1) the magnitude of the ST-segment
elevation ,
2) induciblity of VT/VF--remain
the tool most appropiate for confirmation of diagnosis and risk
stratification in patients with BRS.
Reference:Ikeda,T.,MD,and others,Assement
of noninvasive Markers in Identifying Patients at Risk in the
Brigada Syndrome:Insight into Risk Stratification,JACC,Vol.37,No.6,2001,1630-1634.
Reference:Gussak,Ihor,MD,and others,Clinical Diagnosis and Risk
Stratification in Patients with Brugada Syndrome,JACC,Vol.37,No.6,2001,1635-1638.