Figure 94
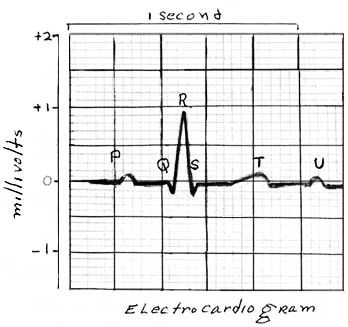
This is an illustration of one of the leads of an EKG showing the various patterns of depolarization of the cardiac conductive system (P, Q, R, S, T, U).
|
|
|
Figure 94 This is an illustration of one of the leads of an EKG showing the various patterns of depolarization of the cardiac conductive system (P, Q, R, S, T, U). |