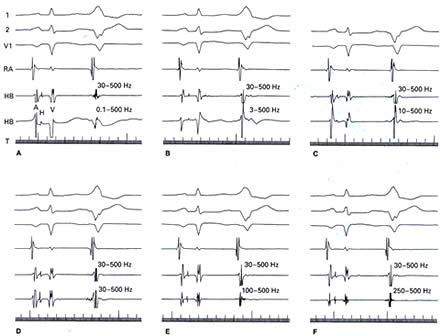
Figure 206-2
Effects of various filtering frequencies on the morphologic appearance of intracardiac electrograms A through F. The tracings from top to bottom are electrocardiographic leads I, II, V1, right atrial (RA), two His bundle (HB) electrograms, and time (T) line. Similar abbreviations are used in subsequent figures and tracings. In each panel, the first beat is of sinus origin and is followed by a spontaneous ventricular premature beat. The top HB, RA, and RV are filtered at 30 to 500 Hz (i.e., the usual filtering frequencies). The bottom HB tracing shows the effect of various filtering frequencies on the appearance. The low-frequency signals are mostly eliminated at high-bandpass filter frequency settings above 10 Hz (C). The low-bandpass filter settings above 500 Hz generally do not have a significant effect on the intracardiac electrogram appearance. It should be pointed out that the high-bandpass setting reduces the overall magnitude of the eLectrogram, necessitating an increase in amplification. It should also be noted that, at all frequencies depicted, the HB deflection can be clearly identified.
(From Akhtar. Reproduced with permission from the publisher and authors.) Akhtar M.Invasive cadiac electrophysiologic studies:An introduction.In:Parmley WW, and others eds. Cardiology, Pharmacology,vlo.1:Physiology, Pharmacology. Diagnosis. Philadelphia:Lippincott;1991:1.