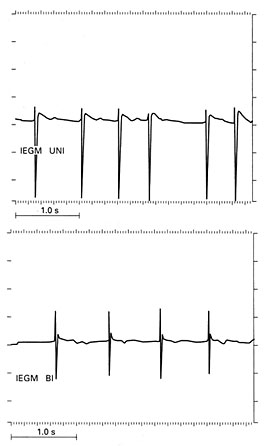
Figure 16f
Unipolar (top) and bipolar (bottom) intracardiac
electrograms (IEFMS) from a patient with a ventricular pace, aker whose
underlying rhythm is atrial fibrillation. Note that the bipolar signal
is sharper, with less sensing of far field ventricular activity or T waves.
With either unipolar or bipolar electrograms, direct measurement of the
electrogram is possible. Each division on the left represents 1 mV. Therefore,
the unipolar intra cardiac electrogram is 2 to 3 mV frombaseline to peak.
The bipolar electrogram would be expected to be approximately 2 mV.