Figure 144
A.
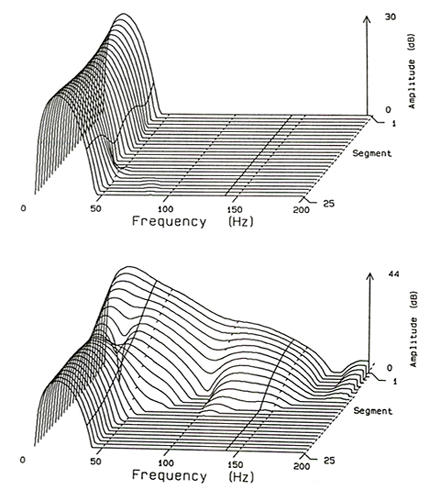
Normal spectral temporal map of the SAECG.
B. Abnormal spectral temporal map. An increase in the spectral amplitude
between 40 and 200Hz in the earlier segments of the map is indicative
of late potentials.