Figure 109g
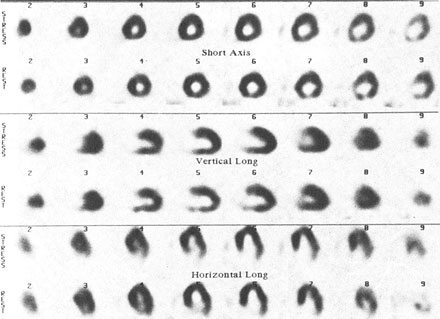
Tomographic slices two pixels in thickness from a 99mTc sestamibi study in a standard display. The top two rows show short axis tomographs from apex to base with stress above, rest below. Note the donut pattern of tracer uptake in this patient without perfusion defects. The middle two rows show the vertical long axis slices displayed from lateral wall to septum. The apex is pointed toward the right. The lower two rows depict the horizontal long axis slices with the apex pointed upward. The septal wall is always shorter than the lateral wall in this projection.
Johnson, L.L., MD, Pohost, G.M., MD, Nuclear Cardiology, Hursts The Heart, 8th edition, p 2281-2295.